November Weekly Updates: Begins Nov 7.
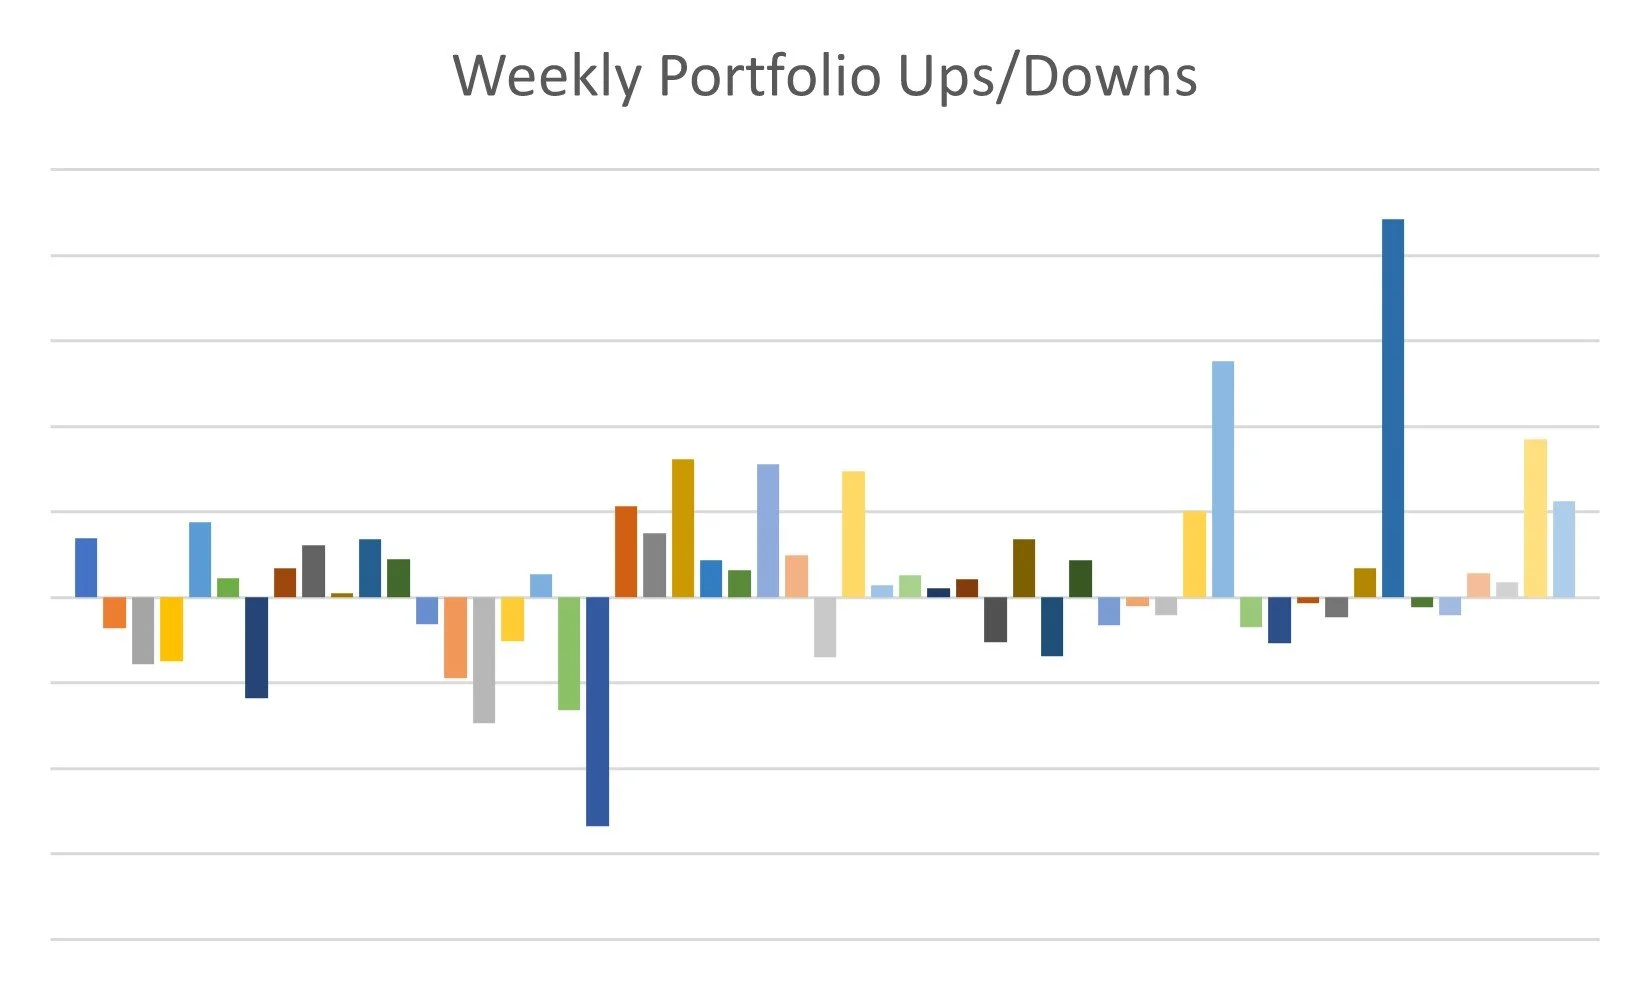
The data used to create this chart is since inception until end of October.
Each bar in the graph along with each weekly update posted above is a % change for that week compared to the previous week only. That is, they are not cumulative. And this is also not the ‘after expenses’ return as I only tally that monthly.
I monitor the week to week change and then report on the cumulative monthly, quarterly, and the ‘since inception’ portfolio changes to reinforce that short-term fluctuations, though they may seem significant, are ultimately minor to meaningless. This goes for the up weeks as well as the down weeks. Over the long term, it’s the broader trend that matters.